When troubleshooting an issue on your site getting the most information can be really helpful in determining the cause. Viewing the browser’s console log is a great way to get more information about what might be happening on your page. In this example, we will use the chrome browser but all modern browsers have development tools.
Step 1: Open Developer Tools
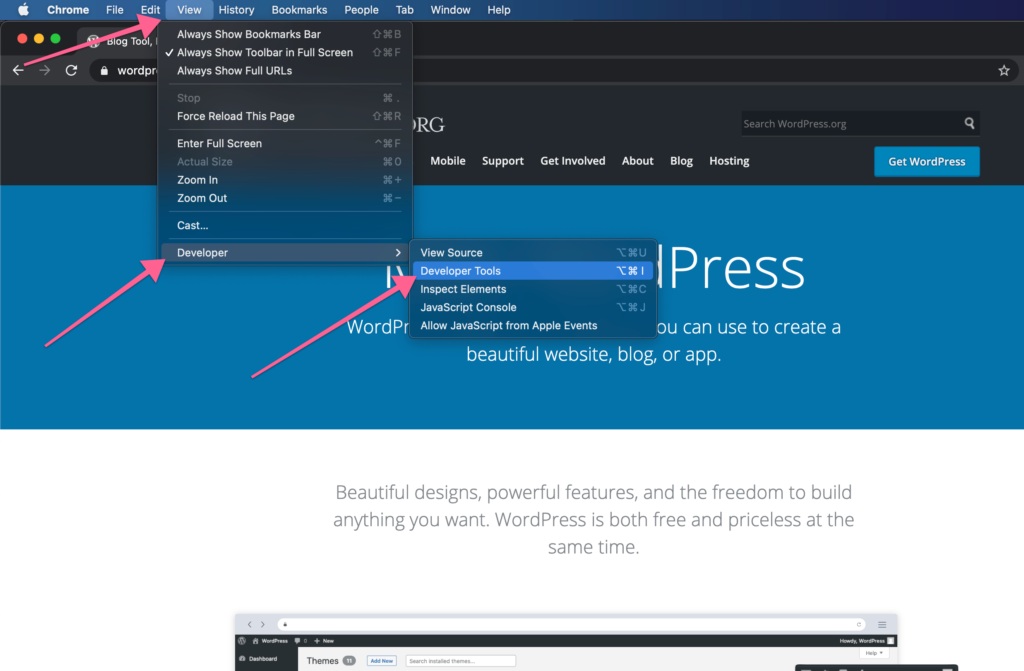
You can also open dev tools by going to “view” in the browser controls and under “developer” choosing development tools.
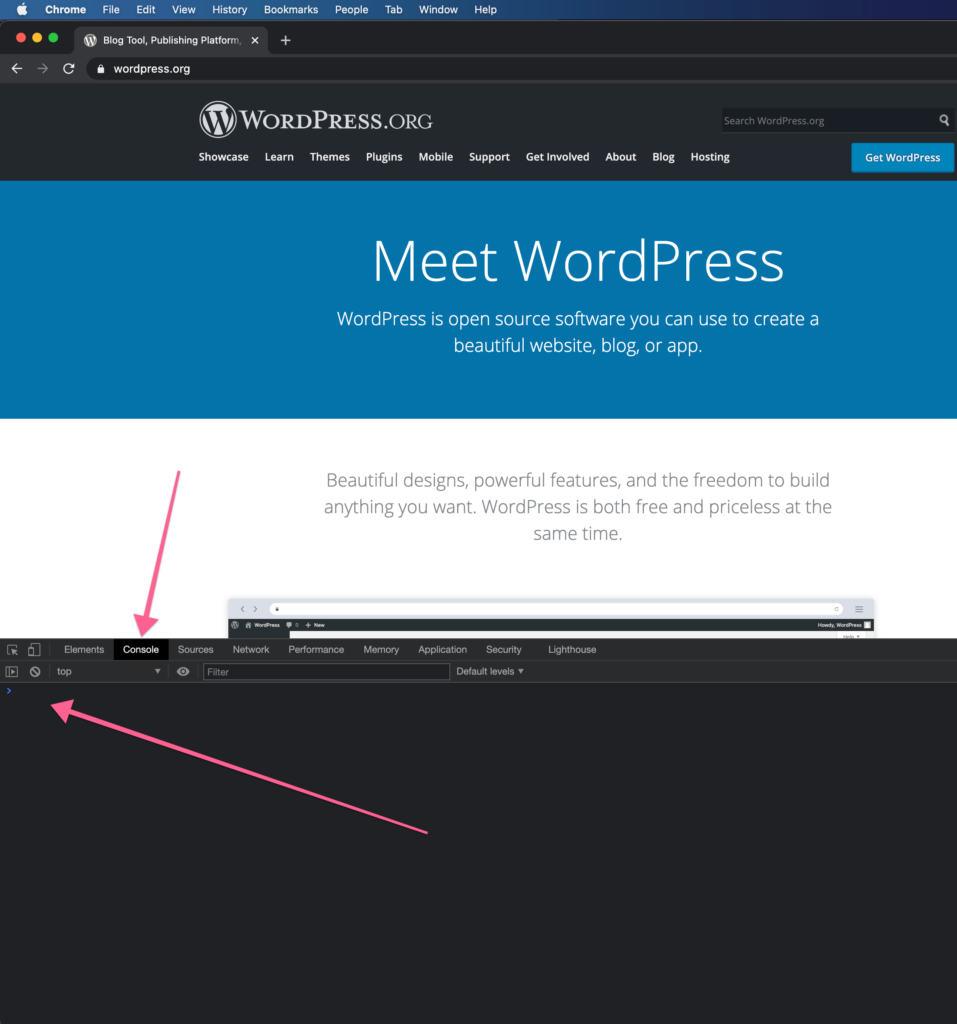
Step 2: View the Console Log
With the developer tools open you can click on the “Console” tab, that will show you errors, warnings and other info. Usually you just need to look at the red highlighted errors.